This user guide provides instructions and tips for using the Penn State Community Impact Map to find Penn State impact and activities across Pennsylvania. If you have any problems or questions, contact us at CommunityImpactMap@psu.edu.
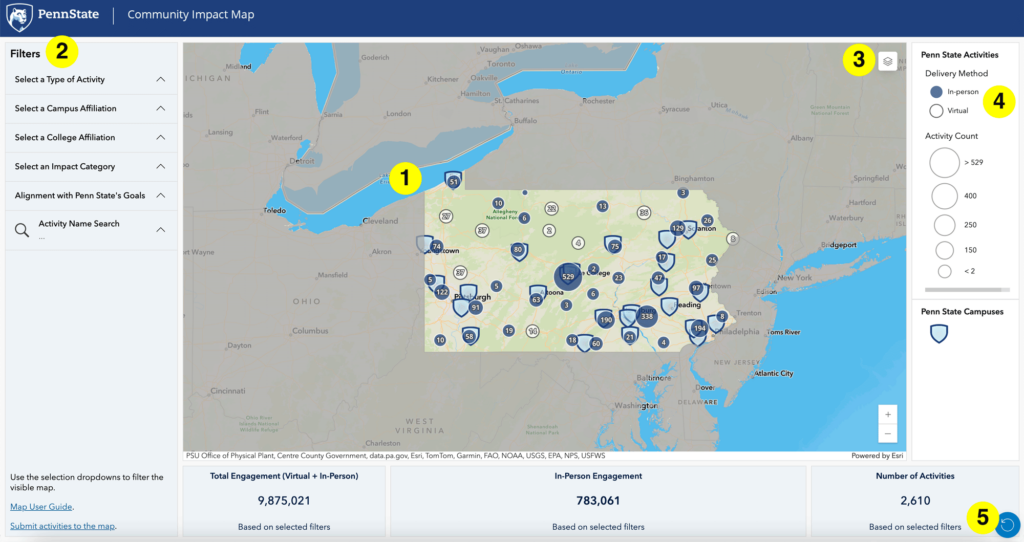
Our user guide will focus on the desktop experience of the map, but the mobile experience is very similar. The user guide will explain five areas of the map:
- Find Activities on the Map: Icons, numbers, and markers will show the location of Penn State activities and impact, based on the filters you select.
- Filters: Interact with the filters to narrow the results on the map to specific campuses, colleges, categories, or activities.
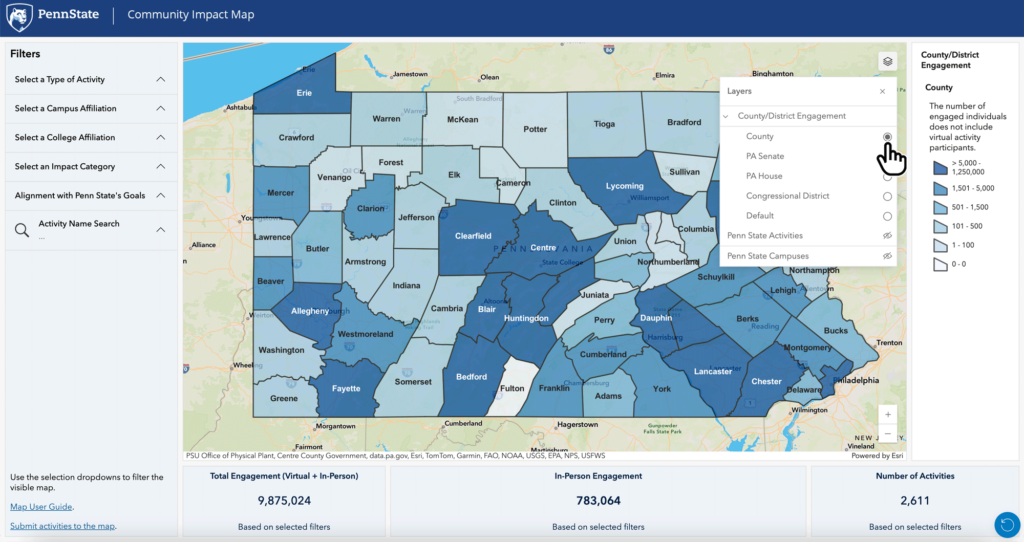
- Layers: View and hide activities and campus locations, and view county lines or congressional districts.
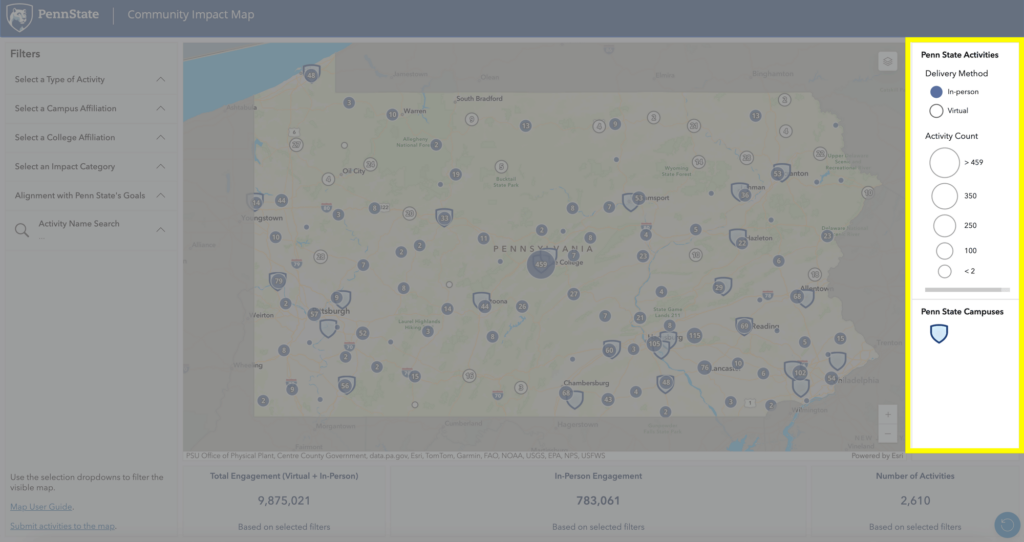
- Legend: The legend defines the icons, markers, and colors you see on the active layers.
- Reset: The reset button will clear all filters and layers and return the map to its original state.
The map of Pennsylvania will display icons and markers showing Penn State activities across the Commonwealth. Zoom in and click on activities to learn more about the University’s impact.
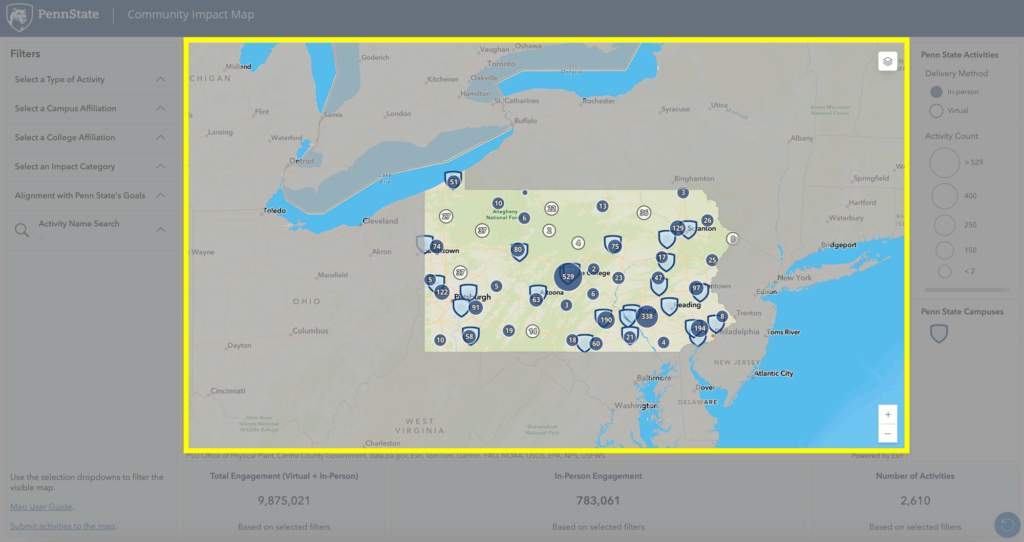
Click a location to learn more about the activities in that cluster.
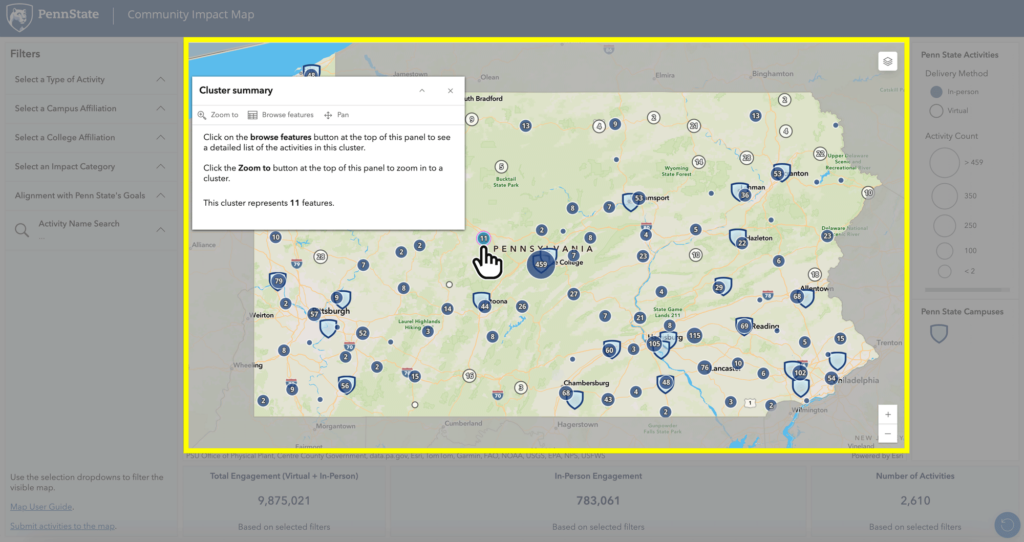
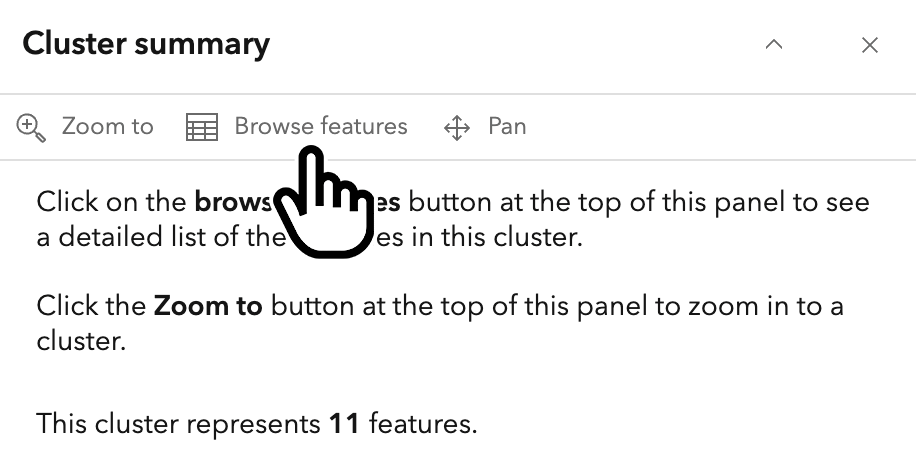
After clicking a location to open a cluster summary, click “Browse features” to view the list of activities from that location.
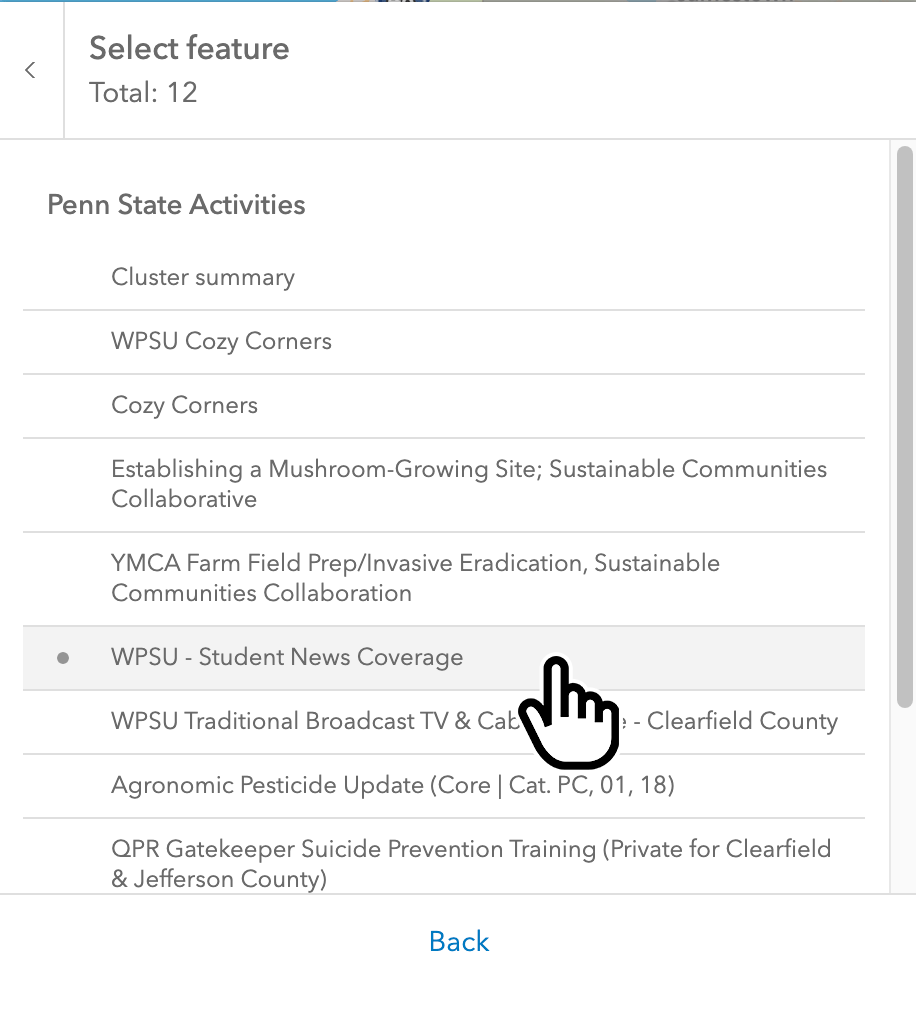
Click individual activities to learn more details.

Select one or more filters to update the results that appear on the map.
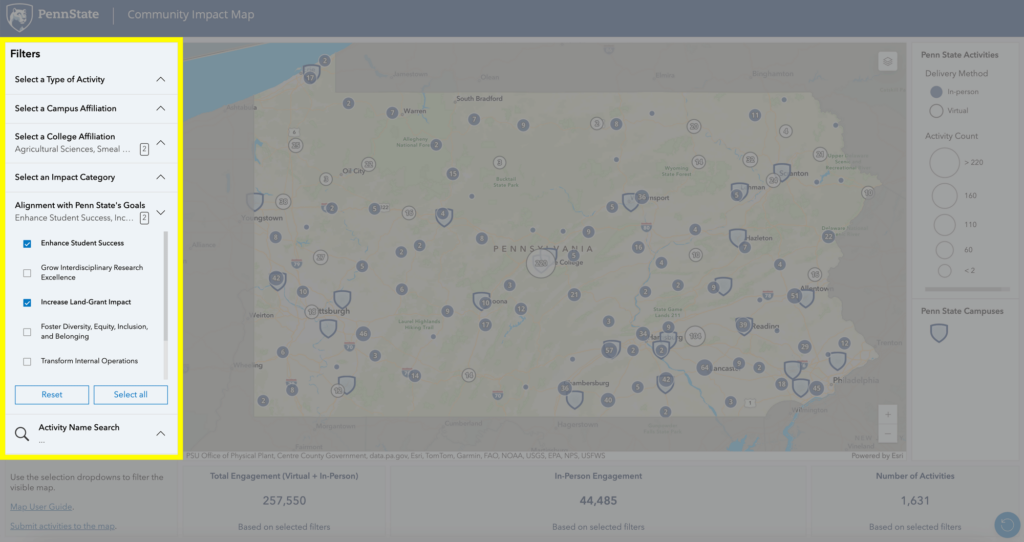
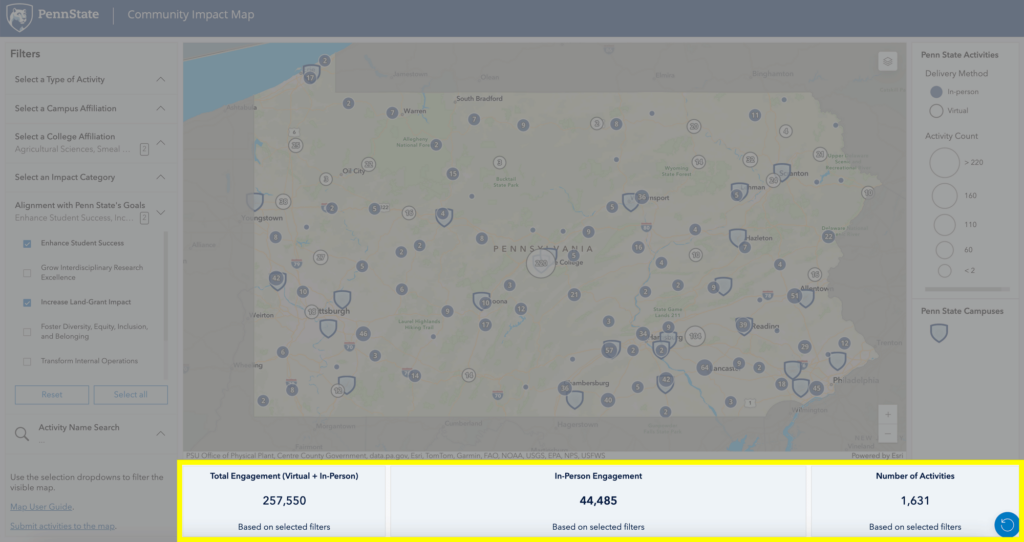
Results on the map will be updated according to the filters. You can also see the total number of individuals engaged and number activities, based on the selected filters.
Open the Layers menu by clicking the icon in the top right of the screen. Layers allow you to view and hide the activities and campus locations, and view engagement and activities per region. By expanding the “County/District Engagement” tab, you can display boundaries and access statistics for counties and districts.

From the Layers menu, click on County or a district type to display that layer on the map.
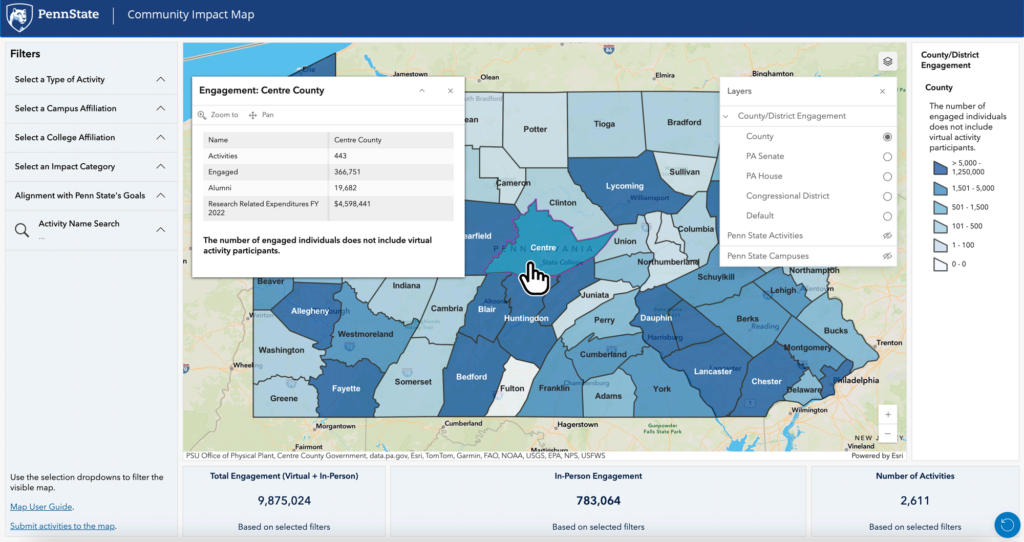
After a layer is displayed on the map, you can click on a county or district to view engagement statistics for that region.
The legend will define the icons and markers seen on the map. It will automatically update when you select layers.
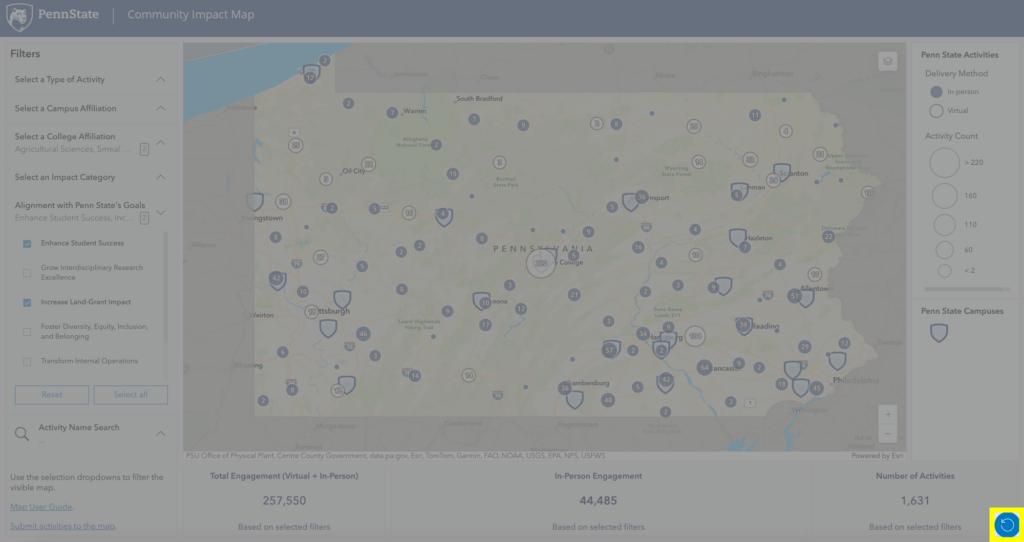
The reset button, found in the bottom right corner of the map, will clear all filters and layers and reset the map to its original state.
